Page last updated May 6, 2024 by Doug McVay, Editor.
Table: Federal Drug Control Spending by Function FY 2013 through FY 2024 as estimated by the Office of National Drug Control Policy.
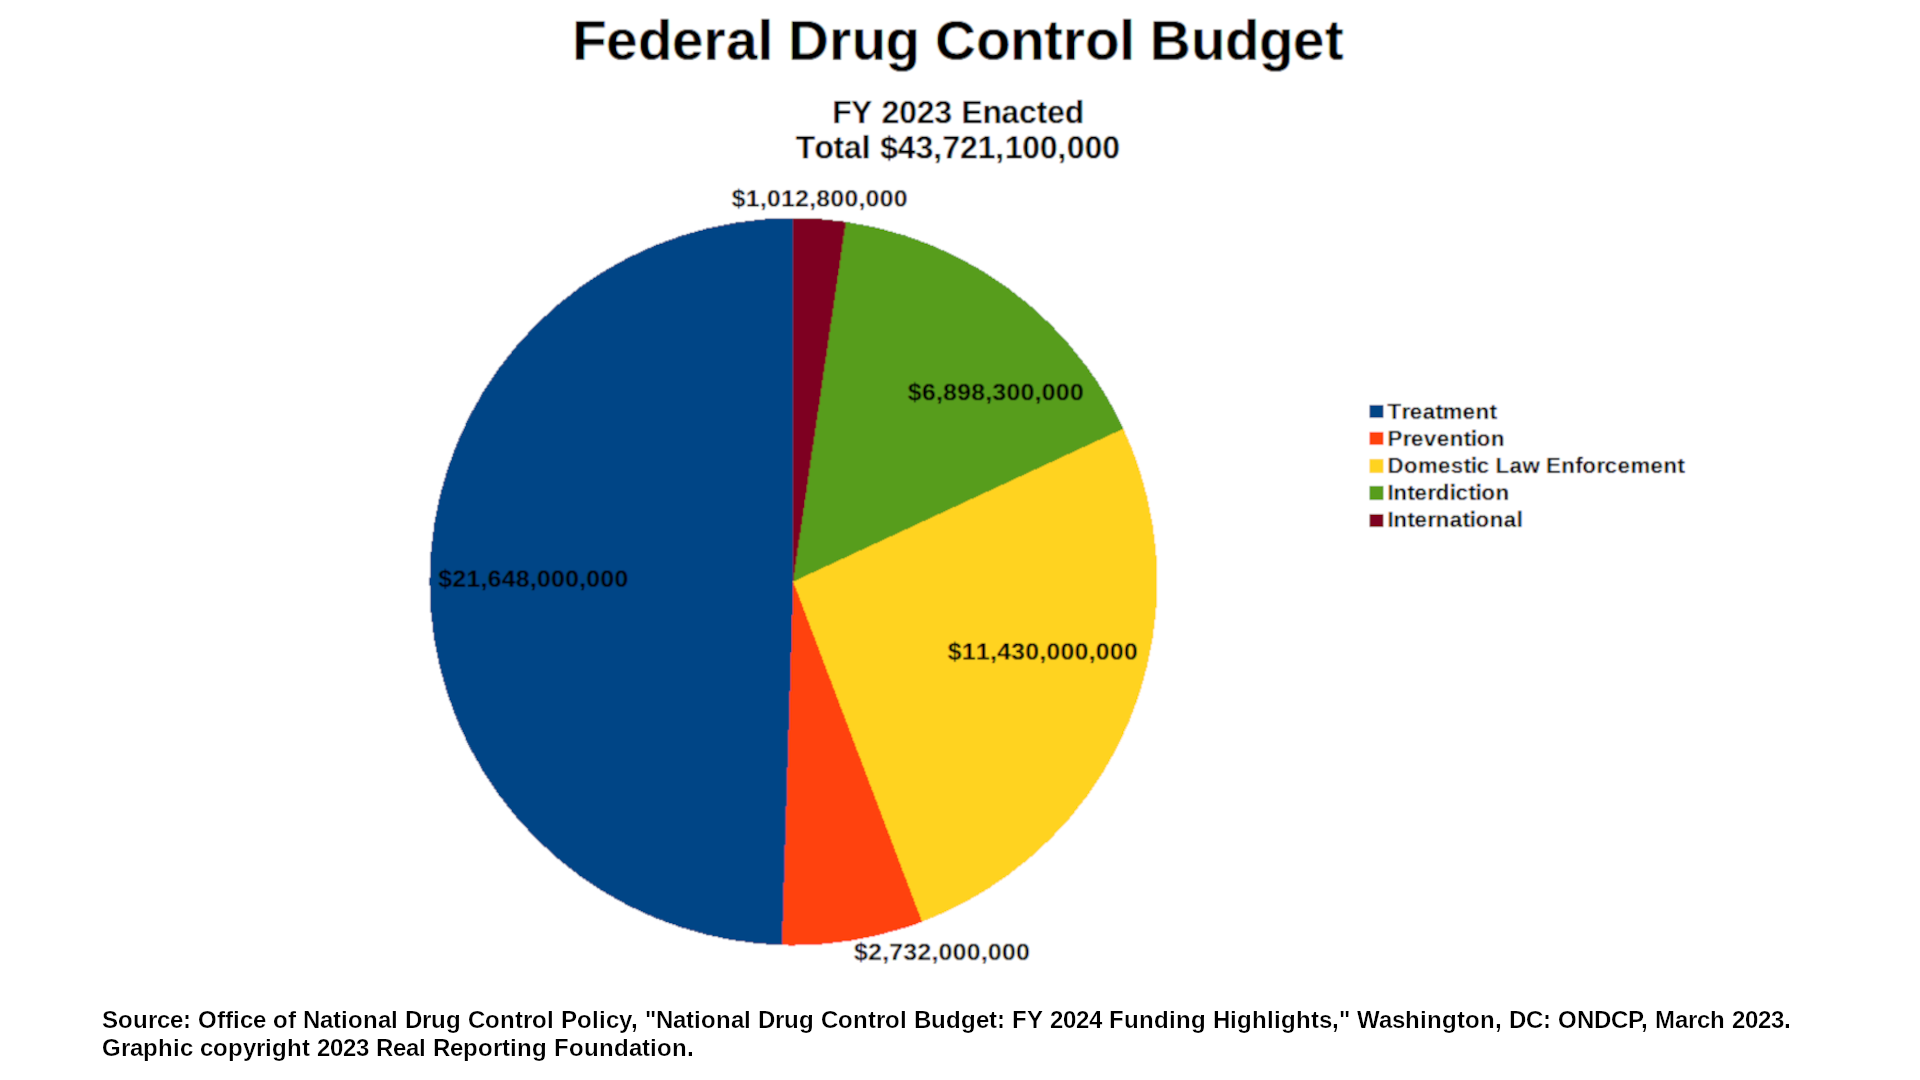
| 1. US National Drug Control Budget "National Drug Control Program agencies are requesting a total of $46.1 billion in drug control funding, an increase of $2.3 billion over the FY 2023 enacted level. The largest increases in funding are requested to support drug treatment (+$825.6 million) and drug prevention (+$808.8 million)." Table: Federal Drug Control Spending by Function FY 2013 through FY 2024 as estimated by the Office of National Drug Control Policy.
Office of National Drug Control Policy, "National Drug Control Budget: FY 2024 Funding Highlights," Washington, DC: ONDCP, March 2023. |
| 2. Treatment More Effective Than Law Enforcement "This study found that the savings of supply-control programs are smaller than the control costs (an estimated 15 cents on the dollar for source-country control, 32 cents on the dollar for interdiction, and 52 cents on the dollar for domestic enforcement). In contrast, the savings of treatment programs are larger than the control costs; we estimate that the costs of crime and lost productivity are reduced by $7.46 for every dollar spend on treatment." Rydell, C.P. & Everingham, S.S. Controlling Cocaine. Santa Monica, CA: Drug Policy Research Center, RAND Corporation. 1994. |
| 3. Cost Savings From Preventing HIV Infection "Effective treatment has increased life expectancy after HIV infection, and deaths from non-AIDS-related causes now exceed deaths from AIDS for those with HIV in the US [35]. Medical costs of treating HIV-infected individuals as they age now include costs of both HIV-related and HIV-unrelated medical care. We estimated the medical cost saved by averting one HIV infection in the United States, taking into account the costs that would have been incurred by similar at-risk individuals in the absence of HIV infection. We project discounted medical cost savings of $229,800 by permanently averting one HIV infection based on current care patterns in the US and $49,500 if one HIV infection is delayed by 5 years. Our analysis shows that as HIV care becomes more effective, the cost avoided by averting one HIV infection also increases. Improved care is cost-effective by accepted standards in the US, it is not cost-saving [36]. The added years of life, however, result in additional costs for treatment that would not have occurred in the absence of an infection. "Our projections of lifetime medical costs for HIV-infected individuals of $326,500 in the base case and $435,200 in the optimal care case are comparable to recent model-based estimates of lifetime costs for individuals in the US entering care with CD4 201–350/μl ($332,300 in 2012 US dollars) and >500/μl ($443,000) respectively [37], and costs from entry into care (not shown) are consistent with previous estimates of these costs in France using the CEPAC model [38]. Our projection of medical cost savings of $229,800 is substantially lower than the previous estimate of $303,100 in 2004 US dollars ($361,400 in 2012 US dollars) [7] for several reasons. First, we now account for medical costs that would have been incurred in the absence of an HIV infection. Second, our previous analysis did not adjust mortality for risk group characteristics that lower average life expectancy [23], thereby reducing costs, nor did they adjust costs for health service utilization by different risk groups. Our life expectancy estimates are lower than two other recent model-based analyses in the United States and the United Kingdom [37, 39], likely reflecting the race/ethnicity and risk-category mortality effects in our model. Our results are consistent with these models, however, in projecting substantial life expectancy losses associated both with becoming HIV infected and with delayed initiation of treatment after infection. "Consistent with other analyses [7, 37], we found that ART medications represent the largest component of cost for HIV-infected individuals. We found that non-HIV chronic care medications represent a substantial component of cost as well, emphasizing the significant cost of managing non-HIV comorbidities in an aging HIV-infected population [13, 40]. These comorbidities are frequently managed by HIV primary care providers [41]. Our results are somewhat sensitive to assumptions about future use of generic HIV drugs in the US. This points to the potential importance of future availability of generic drugs in lowering the cost of HIV care, depending on regimens selected and adherence [32]. "Our analysis also indicates that the value of HIV primary prevention may be greater when the effects of preventing secondary transmission to HIV-uninfected partners are taken into account, which would increase the value of interventions targeting individuals at high risk of transmitting to multiple partners. The magnitude of this impact is greater the longer individuals remain uninfected after avoiding a secondary transmission. The current relatively stable HIV incidence trends in the US [15] suggest these uninfected partners are at high risk for eventual HIV infection. If the probabilities of secondary transmission we used already take into account this additional risk, the value of primary prevention would be even higher." Schackman BR, Fleishman JA, Su AE, et al. The lifetime medical cost savings from preventing HIV in the United States. Med Care. 2015;53(4):293-301. doi:10.1097/MLR.0000000000000308 |
| 4. Cost Savings From Syringe Service Programs in Baltimore, MD and Philadelphia, PA Editor's Note: This article has the following correction: "In the December 1, 2019 Supplement 2 of JAIDS Journal of Acquired Immune Deficiency Syndromes, in the article titled 'Using Interrupted Time Series Analysis to Measure the Impact of Legalized Syringe Exchange on HIV Diagnoses in Baltimore and Philadelphia', the authors mistakenly reported the estimated cost savings for Baltimore to be $62.4 million annually and $624 million over 10 years, and the 1-year return on investment (ROI) factoring in the cost of syringe exchange programs to be $46.8 million. The correct cost savings estimates are $43.4 million annually and $434.3 million over 10 years, and the correct 1-year ROI estimate is $32 million." Following is the original, uncorrected quote: "Our findings also demonstrate that averted HIV diagnoses translated to cost savings for cities where most PLWH are recipients of publicly funded healthcare. The forecasts estimated an average of 1059 HIV diagnoses in Philadelphia and 189 HIV diagnoses in Baltimore averted annually. Multiplying the lifetime costs of HIV treatment per person ($229,800)25 by the average number of diagnoses averted annually in both cities yields an estimated annual saving of $243.4 million for Philadelphia and $62.4 million for Baltimore. Considering diagnoses averted over the 10-year modeled period, the lifetime cost savings associated with averted HIV diagnoses stemming from policy change to support SEPs may be more than $2.4 billion and $624 million dollars for Philadelphia and Baltimore, respectively. Because SEPs are relatively inexpensive to operate,26 overall cost savings are substantial even when deducting program operational costs from the total amount. Considering annual program expense ($390,000 in 2011 for Philadelphia27 and $800,000 estimated in FY 2017 for Baltimore28) (Kathleen Goodwin, Baltimore City Health Department, personal communication, January 3, 2017) and cost savings in each city, and a conservative estimate that 75% of these savings would be experienced in the public sector, the 1-year return on investment in SEPs remains in the hundreds of millions of dollars ($182.5 M for Philadelphia, $46.8 M for Baltimore). Small investments in SEPs may yield large savings in HIV treatment costs, so implementing SEPs may liberate resources for other important interventions, such as expanded access to medication-assisted treatment, overdose prevention, and housing. "Another implication pertains to how variations in SEP implementation may have influenced intervention effectiveness. Policies governing SEPs affect not only the overall number of syringes distributed annually but also the ability of PWID to obtain sufficient coverage for all injection events. For example, PPP's clients may exchange syringes for themselves and others; recent data show that the mean number of syringes exchanged per exchange event increased from 1.53 in 1999 to 1.82 in 2014.13 In addition, PPP's annual syringe distribution has consistently increased from approximately 811,000 in 1999 to 1.2 million in 2014,13 allowing for greater coverage of injection events and more opportunities for disease prevention. "By contrast, Baltimore's SEP had a one-for-one (1:1) exchange policy from 1994 to 1999 but, in 2000, switched to a more restrictive policy, where clients were allowed 1:1 exchange for program-distributed syringes but could receive 1 sterile syringe in exchange for 2 nonprogram syringes. From 2005 to 2014, the SEP returned to the less restrictive 1:1 policy, after which they shifted to a need-based distribution model whereby PWID could access as many syringes as needed. Baltimore City's health commissioner estimated that moving from the 1:1 to the needs-based distribution policy could increase coverage of injection events from 42% to 61%.29 More flexible approaches to syringe access in Baltimore could have resulted in greater injection coverage and more dramatic declines in IDU-associated HIV diagnoses earlier. Regulations limiting clean needle and syringe distribution are important operational issues to consider if policy changes supporting harm reduction for PWID are to have optimal impact." Ruiz, Monica S. PhD, MPHa; O'Rourke, Allison MPHb; Allen, Sean T. DrPH, MPHc; Holtgrave, David R. PhDc; Metzger, David PhDd,e; Benitez, Jose MSWf; Brady, Kathleen A. MDg; Chaulk, C. Patrick MD, MPHh; Wen, Leana S. MDi. Using Interrupted Time Series Analysis to Measure the Impact of Legalized Syringe Exchange on HIV Diagnoses in Baltimore and Philadelphia. JAIDS Journal of Acquired Immune Deficiency Syndromes 82():p S148-S154, December 1, 2019. | DOI: 10.1097/QAI.0000000000002176 |
5. Determining Whether a Syringe Services Program Saves Money"Methods"The research literature on the effectiveness of syringe services programs in controlling HIV transmission among persons who inject drugs and guidelines for syringe services program that are 'functioning very well' were used to estimate the cost-saving threshold at which a syringe services program becomes cost-saving through preventing HIV infections versus lifetime treatment of HIV. Three steps are involved: (1) determining if HIV transmission in the local persons who inject drugs (PWID) population is being controlled, (2) determining if the local syringe services program is functioning very well, and then (3) dividing the annual budget of the syringe services program by the lifetime cost of treating a single HIV infection. "Results"A syringe services program in an area with controlled HIV transmission (with HIV incidence of 1/100 person-years or less), functioning very well (with high syringe coverage, linkages to other services, and monitoring the local drug use situation), and an annual budget of $500,000 would need to prevent only 3 new HIV infections per year to be cost-saving. "Conclusions"Given the high costs of treating HIV infections, syringe services programs that are operating according to very good practices ('functioning very well') and in communities in which HIV transmission is being controlled among persons who inject drugs, will almost certainly be cost-saving to society." Des Jarlais DC, Feelemyer J, McKnight C, Knudtson K, Glick SN. Is your syringe services program cost-saving to society? A methodological case study. Harm Reduct J. 2021;18(1):126. Published 2021 Dec 7. doi:10.1186/s12954-021-00575-4 |
| 6. Substance Use Disorder Treatment Is More Cost Effective Than Incarceration "A review of 11 studies (McCollister and French 2003) found that the benefit–cost ratios associated with substance abuse treatment ranged from 1.33 to 23.33 and that benefits were overwhelmingly because of reductions in criminal activity, with smaller contributions of earnings, and averted health care. Our conclusion is similar, especially when inflating the arrest data. Our benefit–cost ratio is also similar to the CalDATA estimate, despite differences in study design and methodology. However, our estimates of substance abuse treatment costs tend to be lower than those in previous studies. An earlier literature review by Roebuck, French, and McLellan (2003) suggested that the average cost per treatment episode was $7,358 for MM [Methadone Maintenance], $1,944 for standard outpatient, and $9,426 for residential. Our estimates were $2,737, $838, and $2,791, respectively, based on weighted per diem estimates. The lower episode costs in CalTOP were because of shorter lengths of treatment for MM and residential, as the weekly cost of treatment was actually higher ($99 and $235, respectively, in CalTOP, compared with $91 and $194 in Roebuck et al.). For outpatient, lower episode costs were also attributable to lower weekly costs, around $48 versus $121 in Roebuck et al. These discrepancies might reflect geographic differences in the intensity and duration of treatment." Ettner, S. L., Huang, D., Evans, E., Ash, D. R., Hardy, M., Jourabchi, M., & Hser, Y. I. (2006). Benefit-cost in the California treatment outcome project: does substance abuse treatment "pay for itself"?. Health services research, 41(1), 192–213. doi.org/10.1111/j.1475-6773.2005.00466.x |
| 7. Treatment for Substance Use Disorder Is Cost-Effective "Our best estimate is that on average, substance abuse treatment costs $1,583 and is associated with a societal benefit of $11,487, representing a 7:1 ratio of benefits to costs (9:1 when arrest data are “inflated” to proxy for actual crimes committed). This ratio is based on weighted average treatment costs, which reflect expected costs of treatment; 9-month follow-up of clients in all modalities with follow-up survey data, so that as many sources of benefit as possible could be included in the analysis; and benefit measures that demonstrate significant change, so that the estimates are robust to rare events. Sixty-five percent of the total benefit was attributable to reductions in crime costs, including incarceration. Twenty-nine percent was because of increased employment earnings, with the remaining 6 percent because of reduced medical and behavioral health care costs." Ettner, S. L., Huang, D., Evans, E., Ash, D. R., Hardy, M., Jourabchi, M., & Hser, Y. I. (2006). Benefit-cost in the California treatment outcome project: does substance abuse treatment "pay for itself"?. Health services research, 41(1), 192–213. doi.org/10.1111/j.1475-6773.2005.00466.x |
| 8. Retail Price of Heroin in the US, Canada, and the UK Prices Per Gram, 2016 United States: Canada: UK, 2016: UN Office on Drugs and Crime. Retail and Wholesale Drug Prices (In US$), accessed March 20, 2021. |
| 9. Spending on Local Police Departments in the US "In 2020, nearly $80 billion was budgeted for local police departments nationwide (table 15). The estimated 110 departments serving 250,000 or more residents in 2020 accounted for 43% of this funding. (See table 4.) These departments represented fewer than 1% of all local police departments but employed about 41% of all full-time sworn local officers. Police departments serving fewer than 10,000 residents had the smallest budget per FTE sworn officer ($109,000)." Sean E. Goodison, PhD. Local Police Departments Personnel, 2020. November 2022. NCJ305187. US Dept. of Justice, Bureau of Justice Statistics. |
| 10. The Gig Economy, Nightwork, and Stimulant Use "Nightwork—meaning all jobs that are executed during nighttime—increased as cities became connected to electricity in the early twentieth century, and as economies became more connected globally through the internet. In the current 'gig economy' — dominated by those jobs in which people are paid by the task, rather than receiving a fixed salary — work never stops. Part of this 'performance' has to do with adapting to the different temporal demands of the labor market—in other words, the management of sleep and wakefulness. As Crary (2013, p. 17) notes, our modern economies '[undermine] distinction between day and night, between light and dark, and between action and repose … the planet becomes re-imagined as a non-stop work site or an always open shopping mall of infinite choices, tasks, selections, and digression.' "But working at night is not necessarily good for us. Melatonin, the hormone involved in the regulation of our biological clock, is released when we are exposed to daylight. Our bodies follow circadian rhythms of approximately 24-hour cycles, and as Kamps warned me, these rhythms have an impact on our mental and metabolic health (Roenneberg et al. 2003). "Humans have a long history using chemicals to tinker with our circadian rhythms, with caffeine being the most ubiquitous substance used to stay awake, one that is accepted globally as beneficial despite its addictive properties. Historians trace the use of coffee back to the fifth century, in the Sufi monasteries of Mocha, now known as Yemen (Weinberg and Bealer 2001). Caffeine stimulates the central nervous system by blocking the action of adenosine (which causes drowsiness) on its receptors. The popular food writer Pollan (2020), in a recent analysis of caffeine, suggests that without this substance the industrial revolution wouldn’t have happened. Studies in sports medicine attest to caffeine’s positive effects in adults, including increased endurance and strength, improved reaction time, and delayed fatigue (Graham 2001; Sökmen et al. 2008). Adverse effects of caffeine, if taken in high amounts, include disturbed sleep, increased blood pressure, and physical addiction. Caffeine is considered safe to ingest up to about 150 mg per day (or two cups of coffee). "In addition to caffeine, those working at night often resort to cocaine and amphetamines for stamina and to stay awake. The use of cocaine for endurance goes back to the Incas in Peru who for thousands of years have chewed coca leaves for this purpose. The alkaloid cocaine, derived from the plant, was only isolated in the mid-nineteenth century. Amphetamines were discovered shortly thereafter by chemists. In On Speed Rasmussen (2008) traces the history of this category of drugs, showing how early twentieth-century pharmacies in the United States sold invigorating tonics containing cocaine and nasal decongestants containing amphetamines. Its first major use was during World War II, when soldiers used it to boost their performance and alertness, and to suppress appetite (see also Braswell 2005; Rawson et al. 2006). In Japan, it was given to soldiers before they performed their 'kamikaze' suicide bombing missions; in England, 73 million amphetamine tablets were made available to pilots so they would not fall asleep (Braswell 2005). Three years after the war, in 1948, the Japanese Ministry of Health prohibited the production of both tablet and powder form of methamphetamine. Similar moves were made in the United States but, interestingly, the medical establishment continued to defend its legal status and deny its addictive potential. It was only when its use grew further, and more evidence about its addictive potential came to light, that the United States finally passed the 1974 Drug Control Act (Rawson et al. 2006)." Hardon A. Chemical 24/7. Chemical Youth. 2020;183-213. Published 2020 Oct 14. doi:10.1007/978-3-030-57081-1_6 |
| 11. Estimated Economic Impact of Illegal Opioid Use and Opioid-Related Overdose Deaths The White House Council of Economic Advisers [CEA] released its analysis of the economic costs of illegal opioid use, related overdoses, and overdose mortality in November 2017. It reported a dramatically higher estimate than previous analyses, largely due to a change in methodology. Previous analyses had used a person's estimated lifetime earnings to place a dollar value on that person's life. According to the CEA, "We diverge from the previous literature by quantifying the costs of opioid-related overdose deaths based on economic valuations of fatality risk reduction, the “value of a statistical life” (VSL)." The CEA noted that "According to a recent white paper prepared by the U.S. Environmental Protection Agency’s (EPA) Office of Policy for review by the EPA’s Science Advisory Board (U.S. EPA 2016), the EPA’s current guidance calls for using a VSL estimate of $10.1 million (in 2015 dollars), updated from earlier estimates based on inflation, income growth, and assumed income elasticities. Guidance from the U.S. Department of Health and Human Services (HHS) suggests using the range of estimates from Robinson and Hammitt (2016) referenced earlier, ranging from a low of $4.4 million to a high of $14.3 million with a central value of $9.4 million (in 2015 dollars). The central estimates used by these three agencies, DOT, EPA, and HHS, range from a low of $9.4 million (HHS) to a high of $10.1 million (EPA) (in 2015 dollars)." In addition, the CEA assumed that the number of opioid-related overdoses in the US in 2015 was significantly under-reported. According to its report, "However, recent research has found that opioids are underreported on death certificates. Ruhm (2017) estimates that in 2014, opioid-involved overdose deaths were 24 percent higher than officially reported.4 We apply this adjustment to the 2015 data, resulting in an estimated 41,033 overdose deaths involving opioids. We apply this adjustment uniformly over the age distribution of fatalities." The combination of that assumption with the methodology change resulted in a dramatically higher cost estimate than previous research had shows. According to the CEA, "CEA’s preferred cost estimate of $504.0 billion far exceeds estimates published elsewhere. Table 3 shows the cost estimates from several past studies of the cost of the opioid crisis, along with the ratio of the CEA estimate to each study’s estimate in 2015 dollars. Compared to the recent Florence et al. (2016) study—which estimated the cost of prescription opioid abuse in 2013—CEA’s preferred estimate is more than six times higher, reported in the table’s last column as the ratio of $504.0 billion to $79.9 billion, which is Florence et al.’s estimate adjusted to 2015 dollars. Even CEA’s low total cost estimate of $293.9 billion is 3.7 times higher than Florence et al.’s estimate." In contrast, the CEA noted that "Among the most recent (and largest) estimates was that produced by Florence et al. (2016), who estimated that prescription opioid overdose, abuse, and dependence in the United States in 2013 cost $78.5 billion. The authors found that 73 percent of this cost was attributed to nonfatal consequences, including healthcare spending, criminal justice costs and lost productivity due to addiction and incarceration. The remaining 27 percent was attributed to fatality costs consisting almost entirely of lost potential earnings." According to the CDC, there were 25,840 deaths in 2013 related to an opioid overdose. According to the CEA, "We also present cost estimates under three alternative VSL assumptions without age-adjustment: low ($5.4 million), middle ($9.6 million), and high ($13.4 million), values suggested by the U.S. DOT and similar to those used by HHS. For example, our low fatality cost estimate of $221.6 billion is the product of the adjusted number of fatalities, 41,033, and the VSL assumption of $5.4 million. Our fatality cost estimates thus range from a low of $221.6 billion to a high of $549.8 billion." "The Underestimated Cost of the Opioid Crisis," Council of Economic Advisers, Executive Office of the President of the United States, November 2017. |
| 12. Cost-Effectiveness of Syringe Service and Needle Exchange Programs "The infectious disease consequences of injection drug use place a heavy toll on entire communities and are a serious threat to the health and well-being of our nation. The estimated cost of providing health care services to persons living with chronic HCV infection is $15 billion annually.18 The average cost of a hepatitis A–related hospitalization in 2016 was $16 610, and recent hepatitis A virus outbreaks alone have cost the nation at least $270 million since 2016.19 In 2019, HIV care and treatment cost the US government more than $20 billion.20 The cost for treating HIV infections related to the Scott County outbreak is projected to be more than $100 million.21 SSPs are associated with an approximately 50% reduction in HIV and HCV incidence.18 A 2019 study in Philadelphia found that SSPs averted 10 582 HIV infections during a 10-year period. This number equates to a 1-year return on investment of $243.4 million.22 By helping reduce the economic burden of drug use and associated infections, SSPs should be considered an important partner in my Community Health and Economic Prosperity initiative, which views community health as inherently linked with economic outcomes.23" Adams JM. Making the Case for Syringe Services Programs. Public Health Reports. 2020;135(1_suppl):10S-12S. doi:10.1177/0033354920936233 |
| 13. Estimated Savings and Added Revenue from Drug Legalization "This report estimates that legalizing drugs would save roughly $41.3 billion per year in government expenditure on enforcement of prohibition. Of these savings, $25.7 billion would accrue to state and local governments, while $15.6 billion would accrue to the federal government. Approximately $8.7 billion of the savings would result from legalization of marijuana and $32.6 billion from legalization of other drugs. "The report also estimates that drug legalization would yield tax revenue of $46.7 billion annually, assuming legal drugs were taxed at rates comparable to those on alcohol and tobacco. Approximately $8.7 billion of this revenue would result from legalization of marijuana and $38.0 billion from legalization of other drugs." Miron, Jeffey A., and Waldock, Katherine, "The Budgetary Impact of Ending Drug Prohibition," The Cato Institute, Washington, DC: Cato Institute, 2010. |
| 14. Wholesale Price of Heroin in the US and Around the World All Data For 2016 Unless Otherwise Noted. Prices in US$. United States: Mexico: Colombia: Hong Kong: Thailand: Afghanistan: Pakistan: Turkey: UN Office on Drugs and Crime. Retail and Wholesale Drug Prices (In US$), accessed March 11, 2021. |
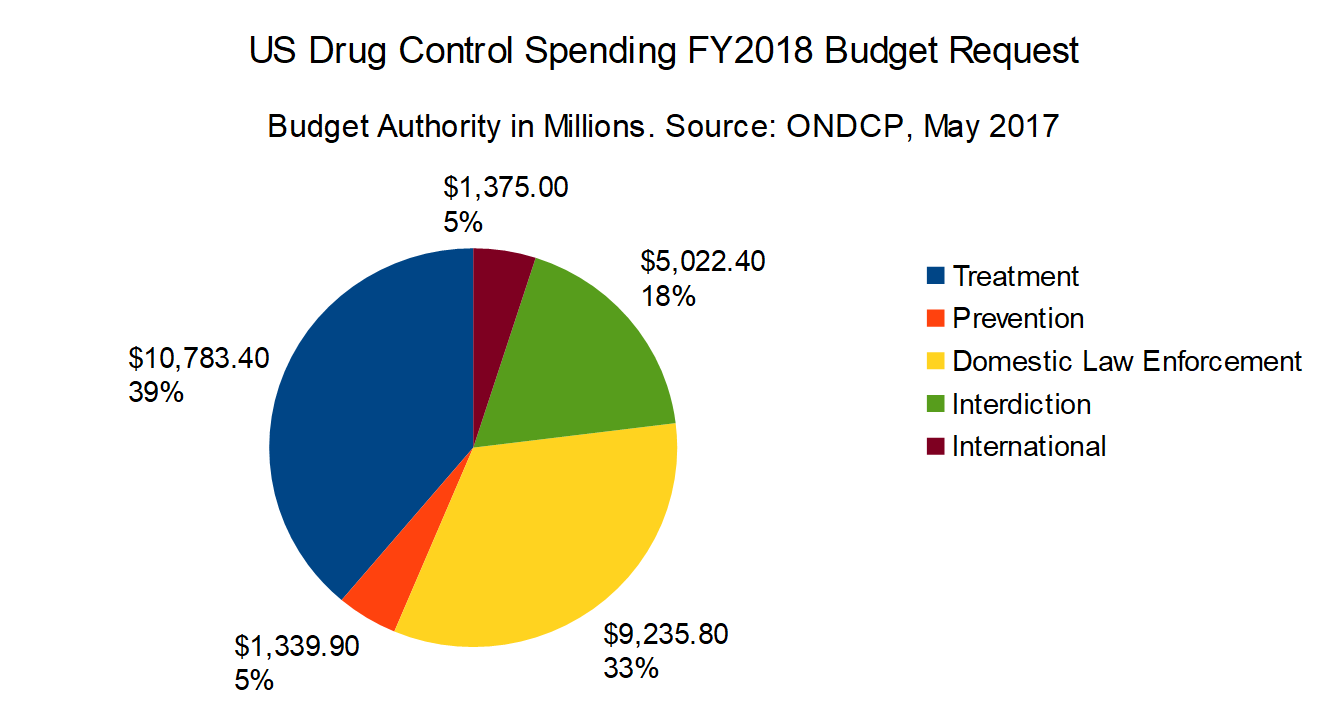
| 15. Accounting Changes in Reporting of Federal Drug Control Spending by Function FY2013 through FY2018 ONDCP changed its method of accounting for treatment spending in its FY2018 report. According to footnote two for table two, p. 18, in the FY2018 budget report: "The estimates for the CMS [Centers or Medicare and Medicaid Services] reflect Medicaid and Medicare benefit outlays (excluding spending under Medicare Part D) for substance use disorder treatment; they do not reflect budget authority. The methodology for Medicaid estimates has been refined from prior years to more accurately reflect spending. The estimates were developed by the CMS Office of the Actuary." Questions have arisen regarding this decision, so in order to provide a better understanding of these figures, here's a Table of Federal Drug Control Spending by Function FY2008 through FY2016 and the request for FY2017 as estimated by ONDCP in December 2016. The FY2017 budget report from ONDCP, which was issued in early January 2017, showed the following final figures for FY2015: Treatment: $12.54 billion (43.4% of total) The FY2018 budget report from ONDCP, which was issued in May 2017, shows the following final figures for FY2015: Treatment: $9.55 billion (36.9% of total) FY2016 figures were also adjusted. According to the FY2017 Budget Report 2016 Enacted: Treatment: $13.25 billion (43.4%) However according to the FY2018 report, FY2016 Final: Treatment: $9.85 billion (36.6% of total) Office of National Drug Control Policy, "National Drug Control Budget: FY 2018 Funding Highlights," Washington, DC: Executive Office of the President, ONDCP, May 2017. |
| 16. UNODC Estimates of the Wholesale Price of Cocaine According to the UN Office on Drugs and Crime:
DataUNODC. Wholesale Drug Price and Purity. Vienna, Austria: United Nations Office on Drugs and Crime. Last accessed June 13, 2021. |
| 17. Local Police Departments in the US "As of December 31, 2020, more than 14,700 general-purpose law enforcement agencies in the United States employed about 708,000 full-time sworn officers and 348,000 full-time civilians. Local police departments accounted for about 80% (11,800) of the general-purpose agencies, employing nearly 67% (473,000) of full-time sworn personnel and 36% (126,000) of full-time civilian personnel (figure 1, table 1).1 "The total number of full-time personnel in local police departments increased nearly 13% from 1997 to 2020. The number of full-time sworn officers with general arrest powers also increased nearly 13%, from 420,000 in 1997 to 473,000 in 2020. The number of full-time civilians increased 24% from 1997 to 2007 (from 111,000 to 138,000) but then decreased nearly 9% (from 138,000 to 126,000) between 2007 and 2020." Sean E. Goodison, PhD. Local Police Departments Personnel, 2020. November 2022. NCJ305187. US Dept. of Justice, Bureau of Justice Statistics. |
| 18. Law Enforcement Personnel in the US "In 2020, about 1,056,000 full-time personnel worked for general-purpose law enforcement agencies at the state, county, or local level (table 2). Of these personnel, almost 57% worked for local police departments. Of the 708,000 full-time sworn officers employed across the country, about 67% worked for local police departments. Local police departments employed 36% of the 348,000 full-time civilian personnel. These departments also employed about 69% of the 86,000 part-time personnel in general-purpose law enforcement agencies. About 79% of full-time personnel and 48% of part-time personnel in local police departments were sworn officers. "In 2020, almost 6% (684) of local police departments had 100 or more full-time-equivalent (FTE) sworn officers (table 3).2 These departments employed 62% of all full-time sworn officers and 69% of all full-time civilian personnel in local agencies nationwide. Almost half (46%) of departments had fewer than 10 FTE sworn officers. " Sean E. Goodison, PhD. Local Police Departments Personnel, 2020. November 2022. NCJ305187. US Dept. of Justice, Bureau of Justice Statistics. |
| 19. Inherent Limitations of Drug Production and Consumption Estimates "Existing estimates about drug production and consumption are cryptic, inconsistent, and often impossible to verify. Apart from the series of studies titled What America’s Users Spend on Illegal Drugs that was produced in the 1990s under ONDCP’s auspices (see Rhodes, 1995, and Abt Associates, 2001) and the 1990s work of the Drug Availability Steering Committee (2002), many of the most-quoted estimates are not documented in a manner that allows others to assess their credibility, let alone replicate them. The large year-to-year changes in official estimates of consumption and particularly of production reduce their credibility, given the stable data on marijuana use in the U.S. population over the past decade. "While a number of estimates are described as being 'intelligence based' or are released by intelligence agencies, this does not mean we should automatically give them high credibility. This paper identifies a number of these estimates from national and international sources that are simply implausible. Drug-market estimation is a field plagued by a lack of data and heavily dependent on assumptions; thus, estimates from both intelligence and nonintelligence agencies need to be scrutinized. Policymakers would be well served by preventing the publication of figures without peer review. If the truth is that these figures are estimated imprecisely, that fact should be noted." Kilmer, Beau; Caulkins, Jonathan P.; Bond, Brittany M.; and Reuter, Peter H. Reducing Drug Trafficking Revenues and Violence in Mexico: Would Legalizing Marijuana in California Help? International Programs and Drug Policy Research Center. Santa Monica, CA: RAND Corporation, October 2010. |
| 20. Reported Educational Achievement and Income of Drug Using Versus Non-Using Full-Time Workers " Workers with a college education had a lower prevalence of current illicit drug use compared with those without a college education. The prevalence of past month use of illicit drugs was lower among those with higher levels of education than those with less education (college graduate [5.7 percent] vs. less than high school [11.2 percent]) (Figure 2.6 and Table 2.3). " The prevalence of current illicit drug use was lower among workers with higher family incomes than among workers with lower family incomes. An estimated 13.2 percent of workers who reported family income that was less than $20,000 had used illicit drugs during the past month. In contrast, 6.0 percent of workers who reported income in the highest category––$75,000 or more––had used illicit drugs during the past month (Figure 2.7 and Table 2.3). " Residents of noncore counties had a lower prevalence of current illicit drug use (4.5 to 6.2 percent) compared with residents of micropolitan statistical area (7.1 percent), small metropolitan statistical area (MSA; 8.8 percent), and large MSA (8.3 percent) counties (Table 2.3)." Larson, S. L., Eyerman, J., Foster, M. S., & Gfroerer, J. C. (2007). Worker Substance Use and Workplace Policies and Programs (DHHS Publication No. SMA 07-4273, Analytic Series A-29). Rockville, MD: Substance Abuse and Mental Health Services Administration, Office of Applied Studies. |
| 21. Estimated Value of US Methamphetamine Market "A more recent study using a demand-side approach estimates that the annual retail value of the U.S. methamphetamine market is between $3 and $8 billion, with a best guess of $5 billion.12 The margin of error is large because the footprint of methamphetamine use does not match the footprint of the data collection system. Methamphetamine use in the United States is concentrated in certain regions, and it is not primarily an urban drug, whereas data collection systems are centered in urban areas. Moreover, because there have been dramatic shifts in methamphetamine consumption and production during the past decade, estimates are highly dependent on the year analyzed. While there are considerable uncertainties, the amphetamine market is clearly smaller than the cocaine and cannabis markets in North America, smaller than the cocaine market in South America, and potentially smaller than markets for other drugs elsewhere in the hemisphere as well. However, data are not available to provide a detailed analysis for all regions." Organization of American States. The Drug Problem in the Americas: Studies: Chapter 4: The Economics of Drug Trafficking. 2013. |
| 22. Ineffectiveness of Interdiction Spending "In 2005, the federal government spent $2.6 billion to disrupt and deter the transport of illicit drugs into the United States. While international efforts to step up drug seizures may affect availability, price and consequences associated with a particular drug (i.e., cocaine or heroin), CASA was unable to find evidence that such strategies have an overall impact on reducing substance abuse and addiction or its costs to government." National Center on Addiction and Substance Abuse at Columbia University. Shoveling Up II: The Impact of Substance Abuse on State Budgets. New York, NY: CASA, May 2009. |
| 23. State Spending on Corrections "State spending on corrections reflects the costs to build and operate prison system and may include spending on juvenile justice programs and alternatives to incarceration such as probation and parole. Total state spending on corrections in fiscal 2020 increased 4.1 percent over fiscal 2019, to $65.9 billion, with a median growth rate of 3.7 percent. State general funds comprised nearly 89 percent of corrections spending in fiscal 2020; no other major area of state government spending is so heavily reliant upon the state general fund. General fund spending for corrections increased 3.3 percent in estimated 2020. In fiscal 2019, total state spending for corrections totaled $63.3 billion, a 3.9 percent increase, with a median growth rate of 3.9 percent. General fund spending grew 3.5 percent in fiscal 2019." National Association of State Budget Officers (2020). 2020 State Expenditure Report: Fiscal Years 2018-2020. |
| 24. Official Estimate of What Americans Spend on Drugs, 2010 " Drug users in the United States spend on the order of $100 billion annually on cocaine, heroin, marijuana, and meth. While this total figure has been stable over the decade, there have been important compositional shifts. In 2000, much more money was spent on cocaine than marijuana; in 2010 the opposite was true. B. Kilmer, S. Everingham, J. Caulkins, G. Midgette, R. Pacula, P. Reuter, R. Burns, B. Han, R. Lundberg, "What America’s Users Spend on Illegal Drugs: 2000-2010," Prepared for:Office of National Drug Control Policy Office of Research and Data Analysis Under HHS contract number: HHSP23320095649WC, Feb. 2014, pp. 3-4. |
| 25. Total Spending on Corrections by State Governments "State spending on corrections reflects the costs to build and operate prison systems and may include spending on juvenile justice programs and alternatives to incarceration such as probation and parole. Total state spending on corrections in fiscal 2020 increased 4.1 percent over fiscal 2019, to $65.9 billion, with a median growth rate of 3.7 percent. State general funds comprised nearly 89 percent of corrections spending in fiscal 2020; no other major area of state government spending is so heavily reliant upon the state general fund. General fund spending for corrections increased 3.3 percent in estimated 2020. In fiscal 2019, total state spending for corrections totaled $63.3 billion, a 3.9 percent increase, with a media growth rate of 3.9 percent. General fund spending grew 3.5 percent in fiscal 2019." National Association of State Budget Officers (2020). 2020 State Expenditure Report: Fiscal Years 2018-2020. |
| 26. Anti-Drug Spending "The narcotics trade has also significantly impeded fiscal growth and stability by diverting scarce resources away from more-productive uses. Between 1981 and 2008, federal, state, and local governments are estimated to have spent at least $600 billion (adjusted for inflation) on drug interdiction and related law enforcement efforts; factoring in costs associated with treatment and rehabilitation, the overall total rises to around $800 billion.34 If one were to also add in 'invisible' losses brought about by curtailed job opportunities and reduced workplace productivity, the true cost would be far higher." Chalk, Peter, "The Latin American Drug Trade: Scope, Dimensions, Impact, and Response," RAND Corporation for the United States Air Force (Santa Monica, CA: 2011), p. 47. |
| 27. The typical "dealer" holds a job and sells to pay for their own use "Earnings for drug selling were positively correlated (though weakly) with legitimate earnings. Drug selling seemed to be a complement to, rather than a substitute for, legitimate employment." Reuter, P., MacCoun, R., & Murphy, P., Money from Crime: A Study of the Economics of Drug Dealing in Washington DC (Santa Monica, CA: The RAND Corporation, 1990), pp. 49-50. |
| 28. Cost of Controlled Prescription Drug (CPD) Diversion "Moreover, the estimated cost of CPD diversion and abuse to public and private medical insurers is $72.5 billion a year,3 much of which is passed to consumers through higher health insurance premiums. Additionally, the abuse of prescription opioids is burdening the budgets of substance abuse treatment providers, particularly as prescription opioid abuse might be fueling heroin abuse rates in some areas of the United States." National Drug Intelligence Center, Drug Enforcement Administration, "National Prescription Drug Threat Assessment," (Washington DC, April 2009), p. V. |
| 29. Official Estimate of the Economic Impact of Illicit Drug Use "In 2007, the cost of illicit drug use totaled more than $193 billion. Direct and indirect costs attributable to illicit drug use are estimated in three principal areas: crime, health, and productivity. "The Economic Impact of Illicit Drug Use on American Society," National Drug Intelligence Center (Washington, DC: United States Department of Justice, April 2011), p. ix-xi. |
| 30. State Spending on Correctional Systems "In 2010, state expenditures totaled $1.9 trillion dollars while state spending on corrections was $48.5 billion. Between fiscal years 1982 and 2010, spending on corrections represented between 1.9% and 3.3% of total expenditures by state governments. Since 2003, corrections expenditures, as a share of total spending, fluctuated between 2.5% and 2.9% of state expenditures (figure 1). Kyckelhahn, Tracey, "State Corrections Expenditures, FY 1982-2010" (Washington, DC: US Dept. of Justice Bureau of Justice Statistics, Dec. 2012), NCJ239672, p. 1. |
| 31. Trends in State Spending on Corrections in the US "The trendline for state prisoner populations continues to slowly decline. According to the Bureau of Justice Statistics, states held 27,788 fewer prisoners at year-end 2019 than in 2018, a decline of 2.2 percent, and more than 143,700 less than in 2009, a decrease of 10.5 percent. Thirty-three states had a decrease in their sentenced prison population in 2019, while 13 states had increases. Even as the number of prisoners continues a gradual decrease, state spending on corrections has seen annual growth. "While the number of prisoners is declining, states will not capture significant savings until the population is reduced enough to close a prison unit or facility, which decreases the number of staff needed. The primary cost drivers in corrections are personnel costs, care and support for inmates including health care, contract costs for community-based programs, and maintenance of a large physical plant. Related to these cost drivers, the mix of prisoners is also changing, with an increasing number of inmates aged 55 or older. In 2011, the percentage of sentenced prisoners under the jurisdiction of states and the federal government in this age group was 7.9 percent; by 2019, that number had risen to 13.1 percent. Having a larger percentage of older inmates often translates to increased health care costs as well as necessary facility changes to accommodate an aging population." National Association of State Budget Officers (2020). 2020 State Expenditure Report: Fiscal Years 2018-2020. |
| 32. State Expenditure Per Prison Inmate According to the federal Bureau of Justice Statistics, in 2010, state corrections institutions spent $37.3 billion to imprison a total of 1,316,858 inmates. BJS estimates that the mean expenditures per capita was $28,323. There was a wide range in state spending: the bottom 25th percentile averaged only $21,417, the 50th percentile averaged $29,094, and the 75th percentile averaged $40,175. Kyckelhahn, Tracey, "State Corrections Expenditures, FY 1982-2010" (Washington, DC: US Dept. of Justice Bureau of Justice Statistics, Dec. 2012), NCJ239672, Table 2, p. 4. |
| 33. Growth in State Spending on Corrections in the US "State correctional spending patterns reflect the rise in the prison population that began in the early 1980’s and persisted until 2010.17 Expansion of the state prison population required increased spending for capital infrastructure, the state employee workforce, and the administrative needs of the judicial system. From fiscal 1986 to fiscal 2012, spending from state funds18 for corrections increased by 427 percent from $9.9 billion to $52.4 billion (without adjusting for inflation).19 By comparison, total spending from state funds increased by 315 percent over the same time period. "For many states, the effect of disproportionate growth in correctional spending led to a larger share of general fund dollars going to corrections. Since the mid 1980’s, the share of general fund budgets going to corrections doubled in 15 states and increased by at least half in 31 states.20 In the aggregate, corrections spending has gone from 4.7 percent of general fund spending in fiscal 1986 to 7.0 percent in fiscal 2012, an increase of 2.3 percentage points. This additional 2.3 percent of state general funds was equivalent to $15 billion in fiscal 2012.21 "Corrections expenditures, as a percent of spending from total state funds, (general funds, other state funds and bonds), have remained more stable, and the rate of increase has been lower compared to the growth in general fund spending. Corrections spending as a share of state funds has gone from 3.6 percent in fiscal 1986 to 4.6 percent in fiscal 2012, an increase of 1 percent.22 This figure has remained more stable due to the rise in earmarked funds or trust funds in other program areas besides corrections that designate revenues for specific purposes set by statute. For example, higher education derives much of its state funding from designated revenue streams outside the general fund. To some extent, this trend may have insulated other program areas from budgetary pressures related to increased general fund spending for corrections." "State Spending for Corrections: Long-Term Trends and Recent Criminal Justice Policy Reforms," National Association of State Budget Officers (Washington, DC: NASBO, Sept. 11, 2013). |
| 34. Spending on Substance Abuse and Addiction " The federal government spent $238.2 billion on substance abuse and addiction or 9.6 percent of the federal budget. If substance abuse and addiction were its own budget category, it would rank sixth in size--behind social security, national defense, income security, Medicare and other health programs. National Center on Addiction and Substance Abuse at Columbia University. Shoveling Up II: The Impact of Substance Abuse on State Budgets |
| 35. State Drug Reforms As Cost-Saving Mechanisms "In general, states are targeting criminal justice reforms to address the cost drivers of correctional budgets in such a way that public safety is not put at risk. For example, 21 states have amended drug offense classification and penalties since 2010.26 Justice reforms that seek incarceration alternatives for drug offenders have demonstrated cost savings and improved outcomes, especially for non-violent drug offenders. Texas appropriated $240 million in the 2008-2009 biennium for correctional programs focusing on treatment, rehabilitation and enhanced local supervision and discretion. The state’s reforms led to $443 million in estimated savings that were utilized for other areas of the corrections budget.27 Justice reinvestment reforms are relying more on local government discretion as well, to enhance probation and parole oversight. Twenty states have enacted graduated sanctions for technical parole violations to help states reduce prison costs and the number of inmates.28 "Despite the demonstrated successes of criminal justice reforms, cost savings have yet to produce an overall decline in corrections spending. However, the policy reforms are improving the way states spend money for corrections, and the outcomes show better results for individuals and citizens. Over time, the cost savings from smart, criminal justice polices may lead to correctional spending declines, an outcome that would benefit all of state government." "State Spending for Corrections: Long-Term Trends and Recent Criminal Justice Policy Reforms," National Association of State Budget Officers (Washington, DC: NASBO, Sept. 11, 2013). |
| 36. Growth in State Spending on Corrections, 1986-2001 "State spending for corrections increased from $65 per resident in 1986 to $134 in 2001 (table 1). Per capita expenditures for State prison operations alone rose from $49 in 1986 to $104 in 2001. "At an average annual increase of 6.2% for total State correctional spending and 6.4% specifically for prisons, increases in the cost of adult incarceration outpaced those of health care (5.8%), education (4.2%), and natural resources (3.3%). "Although correctional spending grew at a faster rate than many other State boards and programs (including court payments between 1986 and 2001, it remained one of the smaller cost items. For example, the outlay for education, at $374.5 billion, was nearly 10 times larger, and that for welfare, at $260.3 billion, was nearly 7 times larger." Stephan, James J., "State Prison Expenditures, 2001," Bureau of Justice Statistics (Washington, DC: US Department of Justice, June, 2004), NCJ202949. |
| 37. Cost Effectiveness of Substance Abuse Treatment "Substance abuse treatment is more cost-effective than prison or other punitive measures. The Washington State Institute for Public Policy (WSIPP) found that drug treatment conducted within the community is extremely beneficial in terms of cost, especially compared to prison. Every dollar spent on drug treatment in the community is estimated to return $18.52 in benefits to society." Justice Policy Institute, "Substance Abuse Treatment and Public Safety," (Washington, DC: January 2008), p. 2. |
| 38. Estimated Potential US Retail Hemp Market "Retail sales of imported hemp products exceeded $70 million in the United States in 2006.62 Given hemp’s wide-ranging utility, supporters of domestic cultivation estimate that it would create a $300 million dollar industry.63" Kolosov, Christine A. Evaluating the Public Interest: Regulation of Industrial Hemp under the Controlled Substances Act. UCLA Law Review. Los Angeles, CA: UCLA School of Law, 2009. |
| 39. Cost of Marijuana Enforcement in Rhode Island "In 2007, there were 1,922 arrests for first-time marijuana possession in Rhode Island. In 2008, there were 584 incidents of incarceration for marijuana possession.1 Ending prohibition and eliminating these arrests would save the state approximately $12.7 million in criminal justice costs." Opendoors, "The Criminal Justice Costs of Marijuana Prohibition in Rhode Island," (Providence, RI: March 2010), p. 1. |
| 40. Growth in US Criminal Justice Spending 1982-2003 "In 2003 the United States spent a record $185 billion for police protection, corrections, and judicial and legal activities. Expenditures for operating the Nation's justice system increased from almost $36 billion in 1982 to over $185 billion in 2003, an increase of 418%" Hughes, Kristen A., "Justice Expenditure and Employment in the United States, 2003" (Washington, DC: US Dept. of Justice, Bureau of Justice Statistics, April 2006), NCJ212260, p. 2. |
| 41. State and Local Criminal Justice Expenditure "• Overall, local police spending represented 45% of the Nation's total justice expenditure, and State corrections accounted for the second largest portion, 33%. Hughes, Kristen A., "Justice Expenditure and Employment in the United States, 2003" (Washington, DC: US Dept. of Justice, Bureau of Justice Statistics, April 2006), NCJ212260, p. 4. |
| 42. Cost for Wiretaps "The expenditures noted reflect the cost of installing intercept devices and monitoring communications for the 2,034 authorizations for which reports included cost data. The average cost of intercept devices in 2011 was $49,629, down 1 percent from the average cost in 2010. For federal wiretaps for which expenses were reported in 2011, the average cost was $71,748, a 13 percent increase from 2010. The cost of a state wiretap ranged from a low of $200 in Hudson County, New Jersey, to a high of $2,885,712 for a narcotics investigation conducted by the New York Organized Crime Task Force." Administrative Office of the United States Courts, 2011 Wiretap Report (Washington, DC: USGPO, June 2012), p. 9. |
| 43. Estimated Savings from Legalizing Drugs in the US "The report estimates that legalizing drugs would save roughly $48.7 billion per year in government expenditure on enforcement of prohibition. $33.1 billion of this savings would accrue to state and local governments, while $15.6 billion would accrue to the federal government. Approximately $13.7 billion of the savings would results from legalization of marijuana, $22.3 billion from legalization of cocaine and heroin, and $12.8 from legalization of other drugs." Miron, Jeffey A., PhD, "The Budgetary Implications of Drug Prohibition," (February, 2010), p. 1. |
| 44. Mexican Marijuana Imports to the US "• Mexican DTOs’ gross revenues from moving marijuana across the border into the United States and selling it to wholesalers is likely less than $2 billion, and our preferred estimate is closer to $1.5 billion. This figure does not include revenue from DTO production and distribution in the United States, which is extremely difficult to estimate with existing data. Kilmer, Beau; Caulkins, Jonathan P.; Bond, Brittany M.; and Reuter, Peter H., "Reducing Drug Trafficking Revenues and Violence in Mexico: Would Legalizing Marijuana in California Help?" International Programs and Drug Policy Research Center (Santa Monica, CA: RAND Corporation, October 2010), p. 3. |
| 45. Drug Control Expenditures Through the 1990s "The most recent figures available from the Office of National Drug Control Policy (ONDCP) indicate that, in 1999, federal expenditures on control of illegal drugs surpassed $17 billion; combined expenditures by federal, state, and local governments exceeded $30 billion. What is more, the nation's so-called 'drug war' is a protracted one. The country has spent roughly this amount annually throughout the 1990s." National Research Council, National Academy of Sciences, "Informing America's Policy on Illegal Drugs: What We Don't Know Keeps Hurting Us" (Washington, DC: National Academy Press, 2001), p. 1. |
| 46. Money Laundering and Mexican Drug Trafficking Organizations "Mexico is a major drug producing and transit country. Proceeds from the illicit drug trade leaving the United States are the principal source of funds laundered through the Mexican financial system. Other significant sources of illegal proceeds being laundered include corruption, kidnapping, extortion, piracy, human trafficking, and trafficking in firearms. Sophisticated and well-organized drug trafficking organizations based in Mexico take advantage of the extensive U.S.-Mexico border, the large flow of legitimate remittances, Mexico’s proximity to Central American countries, and the high volume of legal commerce to conceal transfers to Mexico. The smuggling of bulk shipments of U.S. currency into Mexico and the repatriation of the funds into the United States via couriers or armored vehicles, trade, and wire transfers remain favored methods for laundering drug proceeds. Though the combination of a sophisticated financial sector and a large cash-based informal sector complicates the problem, the 2010 implementation of U.S. dollar deposit restrictions reduced the amount of bulk cash repatriation back to the United States via the formal financial sector by approximately 70 percent, or $10 billion. According to U.S. authorities, drug trafficking organizations send between $19 and $29 billion annually to Mexico from the United States, though the Government of Mexico disputes this figure. Since 2002, Mexico has seized a total of more than $500 million in bulk currency shipments." "International Narcotics Control Strategy Report: Volume II, Money Laundering and Financial Crimes" (Washington, DC: US Dept. of State Bureau for International Narcotics and Law Enforcement Affairs, March 2014), pp. 161-162. |
| 47. Transnational Organized Crime: Supply And Demand "The simple fact is that transnational organized crime is big business in an increasingly globalized economy. From China to Nigeria to Mexico, entrepreneurial criminals will navigate around laws and across borders, supplying illegal or illegally acquired goods and services to meet the demands of the highest bidders. Whether it is drugs, human kidneys, human beings, illegally harvested timber, weapons, or rhinoceros horns, as long as someone is willing to buy it, someone will be willing to sell it." Haken, Jeremy, "Transnational Crime In The Developing World," Global Financial Integrity (Washington, DC: Center for International Policy, February 2011), p. 1. |
| 48. State and Local Spending on Prisons "In 2003, 7.2% of total State and local expenditures was for justice activities – 3% for police protection, 2.6% for corrections, and 1.5% for judicial and legal services (figure 3). Hughes, Kristen A., "Justice Expenditure and Employment in the United States, 2003" (Washington, DC: US Dept. of Justice, Bureau of Justice Statistics, April 2006), NCJ212260, p. 4. |
| 49. Treatment - 3-16-10 "Domestic enforcement costs 4 times as much as treatment for a given amount of user reduction, 7 times as much for consumption reduction, and 15 times as much for societal cost reduction." Rydell, C.P. & Everingham, S.S., Controlling Cocaine, Prepared for the Office of National Drug Control Policy and the United States Army (Santa Monica, CA: Drug Policy Research Center, RAND Corporation, 1994), p. xvi. |
| 50. Economics - Data - 2008 - 4-11-10 (Costs of Juvenile Justice System) "Approximately 93,000 young people are held in juvenile justice facilities across the United States.1 Seventy percent of these youth are held in state-funded, post adjudication, residential facilities, at an average cost of $240.99 per day per youth.2" Justice Policy Institute, "The Costs of Confinement: Why Good Juvenile Justice Policies Make Good Fiscal Sense," (Washington, DC: May 2009), p. 1. |
| 51. Annual Proceeds of Transnational Organized Crime "The overall best estimates of criminal proceeds are close to US$2.1 trillion in 2009 or 3.6% of global GDP [Gross Domestic Product] (95% confidence interval: 2.7%-4.4%). If only typical transnational organized crime proceeds were considered (resulting from trafficking drugs, counterfeiting, human trafficking, trafficking in oil, wildlife, timber, fish, art and cultural property, gold, human organs and small and light weapons), the estimates would be around 1.5% of GDP. About half of these proceeds were linked to trafficking in drugs." "Estimating Illicit Financial Flows Resulting from Drug Trafficking and Other Transnational Organized Crimes," United Nations Office on Drugs and Crime (Vienna, Austria: 2011), p. 9. |
| 52. Drug-Related Public Expenditures in the EU
"Economic analysis can be an important tool for policy evaluation, although the limited information available on drug-related public expenditure in Europe represents a major obstacle and makes comparison between countries difficult. For the 16 countries that have produced estimates since 2002, drug-related public expenditure ranges from 0.01% to 0.5% of their gross domestic product (GDP). From the information available, it appears that the largest share of drug-related public expenditure is allocated to drug supply reduction activities (Figure 4.4). European Monitoring Centre on Drugs and Drug Addiction, "European Drug Report 2014: Trends and Developments" (Lisbon, Portugal: EMCDDA, 2014), p. 70. |
| 53. Historical Prices of Illicit Drugs "In summary, prices for powder cocaine, crack, and heroin declined sharply in the 1980s and have declined more gradually since then, with periodic interruptions by modest price spikes that have usually persisted for a year or less. For d-methamphetamine, the pattern is broadly similar, but the price spikes appear to be larger and longer-lasting, particularly for 1989–1991. Marijuana prices have followed a very different pattern, increasing from 1981 to 1991, then declining through 2000 and increasing over the past three years." Office of National Drug Control Policy, "The Price and Purity of Illicit Drugs: 1981 Through the Second Quarter of 2003" (Washington DC: Executive Office of the President, November 2004), Publication Number NCJ 207768, p. vii. |
| 54. US Counternarcotics Spending in South and Central America "However, during fiscal years 2000-2005, the United States provided about $6.2 billion to support counternarcotics and related programs in the source and transit zones (see table 1).12 In the source zone, U.S. assistance supports eradication and interdiction efforts and related programs for alternative development and judicial reform, primarily in Bolivia, Colombia, and Peru. In the transit zone, the United States provided about $365 million in assistance—primarily to El Salvador, Guatemala, Haiti, and Mexico —to support interdiction and other law enforcement programs." "Drug Control: Agencies Need to Plan for Likely Decline in Drug Interdiction Assets, and Develop Better Performance Measures for Transit Zone Operations," Government Accountability Office (Washington, DC: USGAO, Nov. 2005), GAO-06-200, pp. 10 and 23. |
| 55. State Prison Costs, 2001 "Correctional authorities spent $38.2 billion to maintain the Nation?'s State correctional systems in fiscal year 2001, including $29.5 billion specifically for adult correctional facilities. Day-to-day operating expenses totaled $28.4 billion, and capital outlays for land, new building, and renovations, $1.1 billion. Stephan, James J., "State Prison Expenditures, 2001," Bureau of Justice Statistics (Washington, DC: US Department of Justice, June, 2004), p. 1. |
| 56. Annual Cost of Prescription Drug Diversion "According to law enforcement reporting, some individuals and criminal groups divert CPDs [controlled prescription drugs] through doctor-shopping and use insurance fraud to fund their schemes. In fact, Aetna, Inc. reports that nearly half of its 1,065 member fraud cases in 2006 (the latest year for which data are available) involved prescription benefits, and most were related to doctor-shopping, according to the Coalition Against Insurance Fraud (CAIF). CAIF further reports that diversion of CPDs collectively costs insurance companies up to $72.5 billion annually, nearly two-thirds of which is paid by public insurers. Individual insurance plans lose an estimated $9 million to $850 million annually, depending on each plan’s size; much of that cost is passed on to consumers through higher annual premiums." National Drug Intelligence Center, Drug Enforcement Administration, "National Prescription Drug Threat Assessment," (Washington DC, April 2009), p. 20. |
| 57. Wholesale Price of Heroin in 2010 In 2010, a kilogram of heroin typically sold for an average wholesale price of $2,527.60 in Pakistan. The 2010 wholesale price for a kilogram of heroin in Afghanistan ranged around $2,266. In Colombia, a kilogram of heroin typically sold for $10,772.3 wholesale in 2010. In the United States in 2010, a kilogram of heroin ranged in price between $33,000-$100,000. UN Office on Drugs and Crime, World Drug Report 2012 (United Nations publication, Sales No. E.12.XI.1), Opioids: Retail and wholesale prices by drug type and country (2010 or latest available year) |
| 58. Global Illicit Drug Trade Worldwide/International Basic Data "The global value of the illicit drug trade is extremely difficult to calculate, and as a result estimates have varied dramatically. The 2005 UNODC World Drug Report estimated the worldwide drug trade at $320 billion.8 By contrast, also in 2005, in an issue of The Journal of Drug Issues, Francisco E. Thoumi stated that an unpublished 1999 study by Peter Reuter was 'probably the most serious attempt to ascertain the size of the world illegal drug market.'9 Reuter’s study estimated the value of the market at a range between $45 and $280 billion. Peter Reuter also participated in a more recent study for the European Commission which does not report 'a total estimate for all drugs globally,'10 but does find best estimates of retail revenues to be 'less than one half those of the UNODC, though there is considerable uncertainty.'11 Jeremy Haken, "Transnational Crime in the Developing World" (Washington, DC: Global Financial Integrity/Center for International Policy, Feb. 2011), p. 3. |
| 59. UN Estimate, Drugs and Transnational Crime "If only flows related to drug trafficking and other transnational organized crime activities were considered, related proceeds would have been equivalent to around US$650 billion per year in the first decade of the new millennium, equivalent to 1.5% of global GDP or US$870 billion in 2009 assuming that the proportions remained unchanged. The funds available for laundering through the financial system would have been equivalent to some 1% of global GDP or US$580 billion in 2009. UN Office on Drugs and Crime, "Estimating Illicit Financial Flows Resulting from Drug Trafficking and Other Transnational Organized Crimes," Oct. 2011, p. 7. |
| 60. Distribution of Revenue from Illicit Drug Trafficking " While estimating the size of global and hemispheric drug markets presents tremendous challenges, evidence suggests that some two thirds of total revenues are earned at the final, retail level in consuming countries. Organization of American States, "The Drug Problem in the Americas: Studies: Chapter 4: The Economics of Drug Trafficking," 2013, p. 5. |
| 61. Markups in Illegal Trade and Possible Impact of Legalization "Markups in the illicit drug trade are orders of magnitude higher than markups for legal goods. For example, coffee beans cost around five times more at retail than at farm gate, whereas heroin costs around 170 times more.46 Markups are higher for a number of reasons: participants must be compensated for the risks of incarceration and violence, prohibition reduces the efficiency of production and distribution, the supply chain is long with a large number of middlemen, and some participants have substantial market power. On the production side, the illicit nature of the drug trade reduces efficiency, as drug cultivation must be concealed, transport may not take direct routes and requires extensive bribes, and a drug dealer typically handles far fewer transactions per day than a pharmacist or grocer. Finally, at certain segments of the supply chain, participants may exercise significant market power through controlling trafficking routes or consumer markets. The fact that they face at most limited competition allows them to set higher prices. Organization of American States, "The Drug Problem in the Americas: Studies: Chapter 4: The Economics of Drug Trafficking," 2013, p. 23. |
| 62. Value of Global Opiate Market "The global opiate market was valued at US$68 billion in 2009, with heroin consumers contributing US$61 billion. The value of the world heroin market tends to increase according to the number of international borders crossed by traffickers. That is, heroin is generally cheaper in Afghanistan, a production country, than in West and Central Europe, where the drugs have been transported by various means across long distances and changed hands a number of times. However, this pattern can be deceptive, as heroin prices and consumption levels vary significantly across countries and regions. UNODC, World Drug Report 2011 (United Nations Publication, Sales No. E.11.XI.10), p. 83. |
| 63. Cocaine Market Profit Distribution "In 2008, of the $35 billion U.S. cocaine market, for example, coca farmers in the developing source countries made about $500 million. This equates to 1.4 percent of gross profits. Traffickers within the source countries then made approximately $400 million (one percent), followed by international traffickers (i.e. Mexican drug cartels) who made $4.6 billion (13 percent).25 When added together, only 15 percent ($5.4 billion) of the $35 billion retail value was made in developing source or transit countries. This means that $29.6 billion was generated after the drugs entered the United States." Haken, Jeremy, "Transnational Crime In The Developing World," Global Financial Integrity (Washington, DC: Center for International Policy, February 2011), p. 5. |
| 64. Money Laundering and the Global Opiate Market "Of the US$ 65 billion turnover of the global market for opiates, only 5-10 per cent (US$ 3-5 billion) are estimated to be laundered by informal banking systems. The rest is laundered through legal trade activities (including smuggling of legal goods into Afghanistan) and the banking system." United Nations Office on Drugs and Crime, "Addiction, Crime and Insurgency: The transnational threat of Afghan opium" (Vienna, Austria: October 2009), p. 7. |
| 65. Cost of Substance Abuse in Canada "In 2006 a team of researchers published estimates of the social costs of substance abuse in Canada across several domains based on 2002 data (Rehm et al., 2006). Total costs of substance abuse for all substances (including tobacco) were estimated to be $39.8 billion in 2002, which translates into $1,267 per capita. Of this, approximately 39% are direct costs to the economy associated with health care, enforcement, prevention/research and 'other costs'6, and 61% are indirect costs associated mainly with productivity losses resulting from premature death and disability. Figure 2 depicts the estimated direct social costs associated with alcohol, illicit drugs and cannabis in 2002. Thomas, Gerald and Davis, Christopher G., Comparing the Perceived Seriousness and Actual Costs of Substance Abuse in Canada: Analysis drawn from the 2004 Canadian Addiction Survey," Canadian Centre on Substance Abuse (Ottawa, ON: Canadian Centre on Substance Abuse, March 2007), pp. 2-4. |
| 66. Global Value of Illicit Goods Market "The global illicit flow of goods, guns, people, and natural resources is estimated at approximately $650 billion. Though data is scarce and experts are constantly debating the relative merits and weaknesses of every new study, it is generally accepted that illicit drug trafficking and counterfeiting are the two most valuable markets. This report finds the illicit drug trade to be worth roughly $320 billion and counterfeiting $250 billion." Haken, Jeremy, "Transnational Crime In The Developing World," Global Financial Integrity (Washington, DC: Center for International Policy, February 2011), p. v. |
| 67. Afghan Opium Production "In 2011, the estimated potential opium production amounted to 5,800 mt, an increase by 61% over 2010. As opium cultivation remained relatively stable between 2009 and 2011, the differences in opium production in those years were due to changes in per-hectare opium yield. 2009 was a year with high opium yields (56.1 kg/ha), while in 2010, major opium cultivation areas were affected by plant diseases, which led to a strong yield reduction (29.2 kg/ha). In 2011, opium yields were back to “normal” levels of 44.5 kg/ha. In 2011, the Southern region continued to produce most opium in Afghanistan, representing 85% of national production, followed by the Western region (12%)." "Afghanistan Opium Survey 2011," United Nations Office on Drugs and Crime (Vienna, Austria: United Nations, October 2011), p. 13. |
| 68. Estimate of Global Retail Cannabis Market "The UNODC (2005) estimates that the world retail market for cannabis was about €125 Billion4 circa 2003; more than the retail markets for cocaine and opiates combined. The US is believed to be the largest contributor to this estimate, but the exact size of that market is far from settled. Indeed, some of the estimates of the US market vary by a factor of 10. Beau Kilmer, Rosalie Liccardo Pacula, "Estimating the size of the global drug market: A demand-side approach," Prepared for the Euopean Commission (The RAND Corporation, 2009) p. 8. |
| 69. Economics - Data - Global - 2003 - 1-15-10 (UN Estimate of Value of Global Illicit Drug Market) "If compared to global licit exports (US$7,503 bn in 2003) or compared to global GDP (US$35,765 bn in 2003) the estimated size [of] the global illicit drug market may not appear to be particularly high (0.9% of global GDP at retail level or 1.3% of global exports measures at wholesale level). United Nations Office on Drugs and Crime (UNODC), World Drug Report 2005 (Vienna, Austria: UNODC, June 2005), p. 127. |
| 70. UN Estimate of Value of Illicit Drug Market "Based on the inputs and the calculations explained above, the value of the global illicit drug market for the year 2003 was estimated at US$13 bn [billion] at the production level, at $94 bn at the wholesale level (taking seizures into account), and at US$322bn based on retail prices and taking seizures and other losses into account. This indicates that despite seizures and losses, the value of the drugs increase substantially as they move from producer to consumer. United Nations Office on Drugs and Crime (UNODC), World Drug Report 2005 (Vienna, Austria: UNODC, June 2005), p. 127. |
| 71. Economics - 1-15-10 (Estimates of Size of the World Illegal Drug Market) "It is also worth noting that by 1999, the UNDCP had not attempted to follow up its efforts to estimate the size of the world illegal drug market. That year, the Financial Action Task Force (FATF) [an inter-governmental body focusing on anti-money laundering activities and legislation] decided to begin work to assess the size of the world illegal economy and found it convenient to start with an estimate of the illegal drug market, a task that was considered easier than estimating other illegal activities, given the large work on drugs already available. FATF hired Peter Reuter, a well-known economist who has done extensive work on illegal drug markets, and produced an estimate. This job had the full cooperation of the UNDCP, which opened its data bank to the researcher. Francisco E. Thoumi, "Let’s All Guess the Size of the Illegal Drugs Industry!" Transnational Institute (Amsterdam, The Netherlands: December 2003), p. 7. |
| 72. Economics - 1-15-10 (Value of Illegal Drug Exports from the Caribbean) "The value of illegal drug exports from the Caribbean during the past two decades has fallen into two very well differentiated periods. The first period, from 1981 to 1990, was an epoch of impressive depression in the total value of the Caribbean drugs exports -- from an income over US$20bn at its peak in 1983 to US$5bn in 1991. Since 1991, the value of Caribbean exports of illegal drugs has stabilised around US$5bn." "The Value Of Illegal Drug Exports Transiting The Caribbean - 1981-2000," United Nations Office on Drugs and Crime, Caribbean Regional Office, February 2004, p. 39. |
| 73. UN Estimate of Taliban Opium Revenue "When the Taliban were in power (in the late 1990s) they extracted US$ 75-100 million a year from taxing opium. In the 2005-2008 period the cumulative revenue from opiate farming and trade accruing to Taliban insurgents is estimated at US$ 350-650 million, or an annual average of US$ 90-160 million in Afghanistan alone. This estimate does not include insurgents’ potential revenues from other drug-related activities (labs, imports of precursors) in Afghanistan and from the US$1 billion opiate trade in Pakistan." United Nations Office on Drugs and Crime, "Addiction, Crime and Insurgency: The transnational threat of Afghan opium" (Vienna, Austria: October 2009), p. 7. |
| 74. Economics - Data - 4-13-10 (US Counternarcotics Spending in Afghanistan) "The U.S. Government has been involved in counternarcotics in Afghanistan for over 20 years through various agreements to suppress the production, distribution, and use of illicit drugs and has spent approximately $2 billion on counternarcotics programs in the last 5 years." United States Department of State and the Broadcasting Board of Governors Office of Inspector General, Middle East Regional Office, "Status of the Bureau of International Narcotics and Law Enforcement Affairs Counternarcotics Programs in Afghanistan Performance Audit," Report Number MERO-A-10-02 (Washington, DC: U.S. Department of State: December 2009), p. 3. |
| 75. Public Health Benefits of Drug Control Spending Econometric and Sociopolitical Research "The long-run elasticities provide a basis for estimating potential benefits from changing the current policy mix away from enforcement and interdiction and towards education and treatment. Applying the estimated coefficients, a 10 percent reduction in expenditures on enforcement (about 1 billion dollars by the late 1990s) would be associated with a long-run reduction of over 20% in both the number of deaths and the age-adjusted death rate. This would imply that close to 3,000 deaths a year might be avoided with a shift away from enforcement approaches to drug control. Adding the billion dollars to education and treatment would represent an 18% increase in 1998. The estimated elasticity of 1.59 implies a reduction of close to 5,000 drug-induced deaths per year as a result. Thus, the underlying estimates suggest that very substantial improvements in public health may be achieved by emphasizing education and treatment over enforcement and interdiction." Shepard, Edward & Paul R. Blackley, "US Drug Control Policies: Federal Spending on Law Enforcement Versus Treatment in Public Health Outcomes," Journal of Drug Issues, Vol. 34, No. 4, Fall 2004, pp. 781-782. |
| 76. Demand Elasticity "When the price of an illicit drug changes, the quantity consumed by existing users may change and the total number of users may also respond. The percentage change in total consumption resulting from a 1 percent change in price is referred to as the demand elasticity. For cocaine and cannabis, the elasticity of demand has been estimated at around -0.5, indicating that demand falls by 0.5 percent when price increases by 1 percent.15 This elasticity is similar to that observed for tobacco and implies that a price increase more than compensates for the reduction in demand and results in higher overall drug revenues. There are fewer studies for heroin, but a reasonable estimate for elasticity appears to be around -0.3.16 For methamphetamine, a successful U.S. government effort to reduce the supply of precursor chemicals led the price of the drug to temporarily triple and the purity to decline from 90 percent to 20 percent.17 Simultaneously, amphetamine-related hospital admissions dropped by 50 percent, and use among arrestees declined by 55 percent. However, these indicators returned to their previous levels within four months as prices fell and purity increased." Organization of American States, "The Drug Problem in the Americas: Studies: Chapter 4: The Economics of Drug Trafficking," 2013, pp. 12-13. |
| 77. Drug Markets and the Local Economy "Although the image contained within such quotes is of an external threat associated with the drugs trade, in fact, as May and colleagues were able to show, some of the drug-dealing markets were very much part of the local community – involving people who had lived within the local community for many years. Other drug markets in other areas involved individuals who had no connection to the wider community and whose activities were seen as threatening the local area. While May and colleagues point to the various negative impacts of local drug-selling activities on the wider community, they also point out that such markets could be seen as having a positive impact on the surrounding community. For example, the presence of a drug-dealing market could mean the influx of substantial cash that would otherwise not occur as local drug dealers spent the money earned from their drug-selling activities. Similarly, it was claimed by some of those interviewed that the presence of a drug-dealing market could result in lower levels of other crimes as the drug sellers themselves sought to reduce the activities of other criminals that might attract unwanted police attention. Finally, the presence of a drug market could sustain a thriving market in stolen goods being transacted as a way of supporting a drug habit, one of the results of this being that local people had access to a level of consumer products at reduced prices that they might otherwise never be able to afford." Lloyd, Charlie and McKeganey, Neil, "Drugs Research: An overview of evidence and questions for policy," Joseph Rowntree Foundation (London, United Kingdom: June 2010), p. 43. |
| 78. Loss of Economic Output Due to Criminal Record "Our estimates suggest that ex-offenders lower overall employment rates as much as 0.8 to 0.9 percentage points; male employment rates, as much as 1.5 to 1.7 percentage points; and those of less-educated men as much as 6.1 to 6.9 percentage points. These employment losses hit ex-offenders hardest, but also impose a substantial cost on the U.S. economy in the form of lost output of goods and services. In GDP terms, we estimate that in 2008 these employment losses cost the country $57 to $65 billion per year." Schmitt, John; Warner, Kris and Gupta, Sarika, "Ex-offenders and the Labor Market," Center for Economic and Policy Research (Washington, DC: November 2010), p. 14. |
| 79. Use in Low Income Areas "Although residents of disadvantaged neighborhoods, neighborhoods with high concentrations of minorities, and neighborhoods with high population densities reported much higher levels of visible drug sales, they reported only slightly higher levels of drug use, along with somewhat higher levels of drug dependency. This finding indicates that conflating drug sales with use, so that poor and minority areas are assumed to be the focus of the problem of drug use, is plainly wrong. The finding is based on the data collected across 41 sites, including city and suburban (but not rural) areas in all regions." Saxe, Leonard, PhD, Charles Kadushin, PhD, Andrew Beveridge, PhD, et al., "The Visibility of Illicit Drugs: Implications for Community-Based Drug Control Strategies," American Journal of Public Health (Washington, DC: American Public Health Association, Dec. 2001), Vol. 91, No. 12, p. 1991. |
| 80. Disadvantaged Areas "Although serious drug use is slightly more prevalent in poor minority neighborhoods than elsewhere, the major problem for disadvantaged neighborhoods is drug distribution. These communities are victims not only of their own drug abuse but also of a criminal drug market that serves the entire society. The market establishes itself in disadvantaged communities in part because of the low social capital in these neighborhoods. The drug economy further erodes that social capital." Saxe, Leonard, PhD, Charles Kadushin, PhD, Andrew Beveridge, PhD, et al., "The Visibility of Illicit Drugs: Implications for Community-Based Drug Control Strategies," American Journal of Public Health (Washington, DC: American Public Health Association, Dec. 2001), Vol. 91, No. 12, p. 1992. |
| 81. Economics - Research - 1-15-10 "Nonchronic drug use was not statistically related to either of the labor supply measures, indicating that light or casual drug use did not lead to negative effects on the labor supply." French, Michael T., M. Christopher Roebuck, and Pierre Kebreau Alexandre, "Illicit Drug Use, Employment, and Labor Force Participation," Southern Economic Journal (Southern Economic Association: Oklahoma State University, Stillwater, OK, 2001), 68(2), p. 366. |
| 82. Economics of Prison Construction in the '80s and '90s "The few studies on the local economic impacts of prisons to date have not found significant positive impacts. For example, a study by the Sentencing Project challenges the notion that a new prison brings economic benefits to smaller communities. Using 25 years of data from New York State rural counties, the authors looked at employment rates and per capita income and found 'no significant difference or discernible pattern of economic trends' between counties that were home to a prison and counties that were not home to a prison (King, Mauer, and Huling 2003). According to a recent study by Iowa State University, many towns that made sizeable investments in prisons did not reap the economic gains that were predicted (Besser 2003). Another analysis in Texas found no impacts as measured by consumer spending in nearly three-fourths of the areas examined (Chuang 1998)." Lawrence, Sarah and Jeremy Travis. The New Landscape of Imprisonment: Mapping America's Prison Expansion. Washington, DC: Urban Institute, April 2004. |
| 83. Economic Incentive for Prison Construction "The economic benefits of new prisons may come from the flow of additional state and federal dollars. In the decennial census, prisoners are counted where they are incarcerated, and many federal and state funding streams are tied to census population counts. According to the U.S. General Accounting Office (2003), the federal government distributes over $140 billion in grant money to state and local governments through formula-based grants. Formula grant money is in part based on census data and covers programs such as Medicaid, Foster Care, Adoption Assistance, and Social Services Block Grant (U.S. General Accounting Office 2003). Within a state, funding for community health services, road construction and repair, public housing, local law enforcement, and public libraries are all driven by population counts from the census." Lawrence, Sarah and Jeremy Travis. The New Landscape of Imprisonment: Mapping America's Prison Expansion. Washington, DC: Urban Institute, April 2004. |
| 84. Effect of Termination of Addiction Disability Payments "While the aim of SSI [Supplemental Security Income] addiction disability termination was, for conservatives, to force individuals to take greater responsibility in their lives and to decrease dependence on governmentally funded programs, this goal appears nearly impossible to achieve given the lack of resources had by this under-skilled and poor population. Nor did the policy change necessarily decrease their risk of continued involvement in drugs and crime. We estimate that losing a stable housing situation has placed respondents at greater risk for continued drug and alcohol use, something not considered by extant etiological work on individual substance abuse. These consequences could mean a greater dependence of this population on state and federally funded programs." Anderson, Tammy L., Caitlin Shannon, Igor Schyb, and Paul Goldstein, "Welfare Reform and Housing: Assessing the Impact to Substance Abusers," Journal of Drug Issues (Tallahassee, FL: Florida State University, Winter 2002), Vol. 32, No. 1, p. 290. |
| 85. Substance Use, Welfare Reform, and Housing "First, PRWORA of 1996 has destabilized the housing situations of the respondents and has placed them at greater risk for various types of housing problems and homelessness. Second, these housing complications have exacerbated numerous social problems (drug and alcohol abuse, crime, and victimization). It is important to consider, however, that changes in the housing market, decreased housing subsidies, and individual characteristics and behaviors also played a role in these negative outcomes. Anderson, Tammy L., Caitlin Shannon, Igor Schyb, and Paul Goldstein, "Welfare Reform and Housing: Assessing the Impact to Substance Abusers," Journal of Drug Issues (Tallahassee, FL: Florida State University, Winter 2002), Vol. 32, No. 1, pp. 288-289. |
| 86. Termination of Benefits and Risk of Substance Use "A qualitative analysis, featuring in-depth interviews with 101, nonrandomly selected former recipients revealed that disability benefits promoted housing autonomy, successful cohabitation, and overall housing stability. The termination of benefits, at a time of diminishing social services (e.g., cash and housing assistance) and a housing market explosion, increased various types of homelessness for respondents and dependency on family and friends. Such negative living outcomes, in turn, further escalated the risk of drug and alcohol use, criminal participation, and victimization." Anderson, Tammy L., Caitlin Shannon, Igor Schyb, and Paul Goldstein, "Welfare Reform and Housing: Assessing the Impact to Substance Abusers," Journal of Drug Issues (Tallahassee, FL: Florida State University, Winter 2002), Vol. 32, No. 1, p. 265. |
| 87. Drug Sales and the Informal Economy In a report funded by the Wisconsin Policy Research Institute, researchers concluded that "drug sales in poor neighborhoods are part of a growing informal economy which has expanded and innovatively organized in response to the loss of good jobs." The report characterizes drug dealing as "fundamentally a lower class response [to the information economy] by men and women with little formal education and few formal skills," and the report notes "If the jobs won't be created by either the public or private sector, then poor people will have to create the jobs themselves." Hagedorn, John M., Ph.D., The Business of Drug Dealing in Milwaukee (Milwaukee, WI: Wisconsin Policy Research Institute, 1998), p. 3. |
| 88. Drug Control Models "In the most common English usage decriminalisation is the elimination of a conduct or activity from the sphere of criminal law, while depenalisation is simply the relaxation of the penal sanction provided for by law. The term decriminalisation is most commonly used in reference to offences related to drug consumption and usually manifested by the imposition of sanctions of a different kind (administrative) or the abolition of all sanctions; other (non-criminal) laws can then regulate the conduct or activity that has been decriminalised. Depenalisation can refer to consumption-related offences (which may be dealt with through referral schemes or alternative sanctions for drug users) but also to small-scale trading, generally indicating elimination or reduction of custodial penalties, although the conduct or activity remains a criminal offence. Confusingly, in Spanish, depenalisation often refers to what in English is most often called decriminalisation. Legalisation is the removal from the sphere of criminal law of all drug-related offences: use, possession, cultivation, production, trading, and so on. Regulation refers to a strictly controlled legal market, in which administrative rather than criminal law regulates production, distribution and price (by taxation); and limits availability and access, using models developed for pharmaceutical drugs, alcohol and tobacco." Jelsma, Martin, "The Development of International Drug Control: Lessons Learned and Strategic Challenges for the Future," Global Commission on Drug Policies (Rio de Janeiro, Brazil: January 2011), p. 9. |
| 89. Drug Supply Models Prescription Transform Drug Policy Foundation, "After the War on Drugs: Blueprint for Regulation," (Bristol, United Kingdom: September 2009) pp. 20, 23, 24-27. |
| 90. Prohibition Fails To Prevent Drug Use "Prohibition has two effects: on one hand it raises supplier costs, disrupts market functioning and prevents open promotion of the product; on the other, it sacrifices the authorities’ ability to tax transactions and regulate operation of the market, product characteristics and promotional activity of suppliers. The cannabis prevalence rates presented in Figure 1 show clearly that prohibition has failed to prevent widespread use of the drug and leaves open the possibility that it might be easier to control the harmful use of cannabis by regulation of a legal market than to control illicit consumption under prohibition. The contrast between the general welcome for tobacco regulation (including bans on smoking in public places) and the deep suspicion of prohibition policy on cannabis is striking and suggests that a middle course of legalised but limited consumption may find a public consensus." Pudney, Stephen, "Drugs Policy – What Should We Do About Cannabis?" Centre for Economic Policy Research: London, England, April 2009. |
| 91. Cost/Benefit of Adult Offender Drug Treatment "The legislature directed the Washington State Institute for Public Policy (Institute) to evaluate the costs and benefits of certain juvenile and adult criminal justice policies, violence prevention programs, and other efforts to decrease particular 'at-risk' behaviors of youth." Click here for complete datatable of Benefit to Cost Ratios of Adult Drug Treatment Programs. Aos, Steve; Phipps, Polly; Barnoski, Robert; Lieb, Roxanne, "The Comparative Costs and Benefits of Programs to Reduce Crime," Washington State Institute for Public Policy (Olympia, WA: May 2001), pp. 1, 23-26. |